Ahead of what promises to be one of the most closely fought general elections in recent history, MM profiles all of the Greater Manchester constituencies.
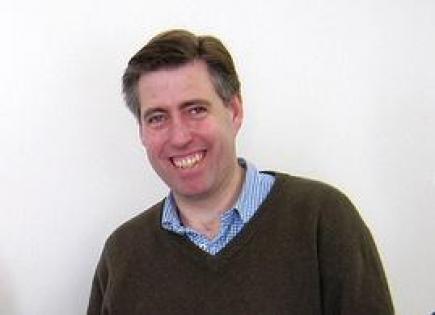
Conservative MP Graham Brady (©Manchester Friends of the Earth, with thanks)
Altrincham and Sale West
Held by Conservative incumbent Graham Brady, chairman of the backbench 1922 Committee, since the constituency was created in 1997.
Candidates: Graham Brady (Conservative), James Wright (Labour), Jane Brophy (Liberal Democrat), Nick Robertson-Brown (Green).
2010 Result: Conservative 24,176 (48.9%), Liberal Democrat 12,581 (25.5%), Labour 11,073 (22.4%), UKIP 1,563 (3.2%)
2005 Result: Conservative 20,569 (46.4%), Labour 13,410 (30.3%), Liberal Democrat 9,595 (21.7%), UKIP 736 (1.7%)
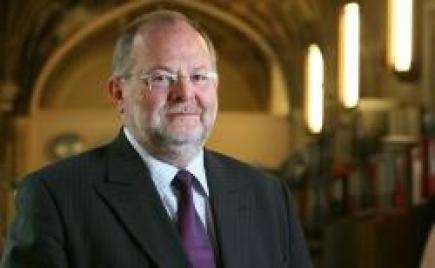
Labour MP David Heyes (©The Climate Coalition, with thanks)
Ashton-under-Lyne
Represented by Labour MP David Heyes since 2001, who is standing down due to health problems.
Candidates: Angela Rayner (Labour), Carly Hicks (Liberal Democrat), Angela McManus (UKIP).
2010 Result: Labour 18,604 (48.4%), Conservative 9,510 (24.7%), Liberal Democrat 5,703 (14.8%), BNP 2,929 (7.6%), UKIP 1,686 (4.4%).
2005 Result: Labour 21,211 (57.4%), Conservative 7,259 (19.6%), Liberal Democrat 5,108 (13.8%), BNP 2,051 (5.5%), UKIP 768 (2.1%).
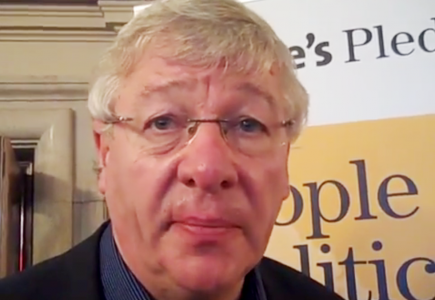
Labour MP Graham Stinger (©People’s Pledge, via YouTube, with thanks)
Blackley and Broughton
Cross-border seat with wards from Manchester and Salford, represented since its creation in 2010 by Labour’s Graham Stringer.
Candidates: Graham Stringer (Labour), Michelle Tanfield-Johnson (Conservative), Richard Gadsden (Liberal Democrat)
2010 Result: Labour 18,563 (54.3%), Conservative 6,620 (18.3%), Liberal Democrat 4,861 (14.2%), BNP 2,469 (7.2%), Respect-Unity Coalition 996 (2.9%), UKIP 894 (2.6%), Christian 161 (0.5%).
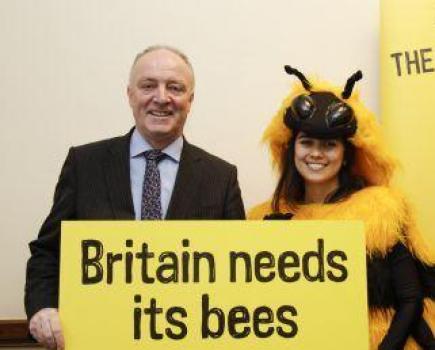
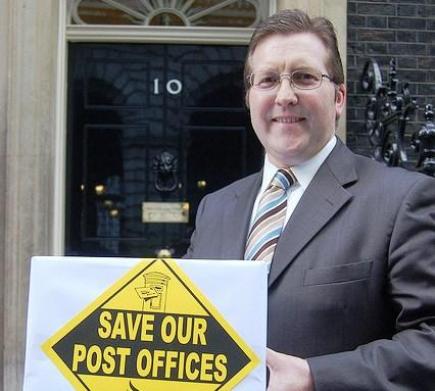
Labour MP David Crausby (©Manchester Friends of the Earth, with thanks)
Bolton North East
Marginal seat, held by Labour MP David Crausby since 1997.
Candidates: David Crausby (Labour), James Daly (Conservative), Stephen Rock (Liberal Democrat), Laura Diggle (Green), Harry Lamb (UKIP).
2010 Result: Labour 19,870 (45.9%), Conservative 15,786 (36.5%), Liberal Democrat 5,624 (13%), UKIP 1,815 (4.2%)
2005 Result: Labour 16,874 (45.7%), Conservative 12,771 (34.6%), Liberal Democrat 6,044 (16.4%), UKIP 640 (1.7%)
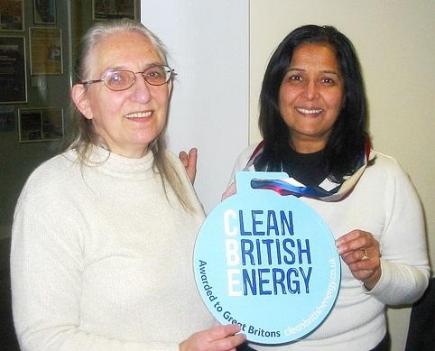
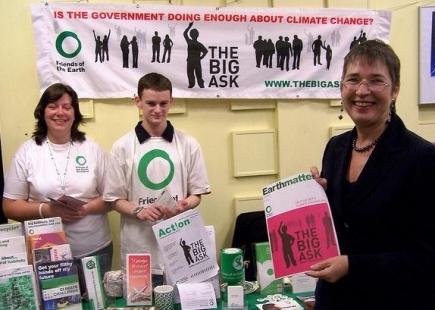
Labour MP Yasmin Qureshi (right) (©Manchester Friends of the Earth, with thanks)
Bolton South East
Unlike the other Bolton seats, this is considered safe Labour territory. Represented by Yasmin Qureshi since 2010.
Candidates: Yasmin Qureshi (Labour), Darren Reynolds (Liberal Democrat), Alan Johnson (Green)
2010 Result: Labour 18,782 (47.4%), Conservative 10,148 (25.6%), Liberal Democrat 6,289 (15.9%), BNP 2,012 (5.1%)
2005 Result: Labour 18,129 (56.9%), Conservative 6,491 (20.4%), Liberal Democrat 6,047 (19%), UKIP 840 (2.6%)
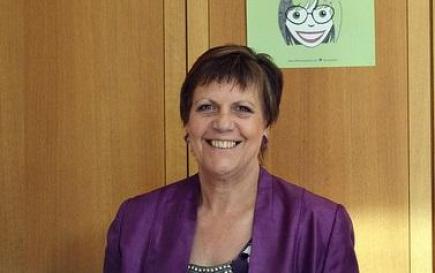
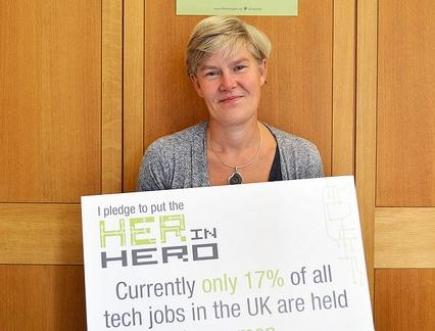
Labour MP Julie Hilling (©LadyGeekTV, with thanks)
Bolton West
Marginal seat between Labour and Conservative, held by Labour’s Julie Hilling, and formerly by ex-Labour minister Ruth Kelly. Won with a majority of just 92 votes in 2010.
Candidates: Julie Hilling (Labour), Christopher Green (Conservative), Andrew Martin (Liberal Democrat), Bob Horsefield (UKIP)
2010 Result: Labour 18,327 (38.5%), Conservative 18,235 (38.3%), Liberal Democrat 8,177 (17.2%), UKIP 1,901 (4%)
2005 Result: Labour 17,239 (42.5%), Conservative 15,175 (37.4%), Liberal Democrat 7,241 (17.9%), UKIP 524 (1.3%)
Conservative MP David Nuttall (©The Freedon Association, with thanks)
Bury North
Important marginal seat between Labour and Conservative. Bury North was the only Conservative gain, taken by David Nuttall, in Greater Manchester in 2010.
Candidates: David Nuttall (Conservative), James Frith (Labour), Richard Baum (Liberal Democrat)
2010 Result: Conservative 18,070 (40.2%), Labour 15,827 (35.2), Liberal Democrat 7,645 (17%), BNP 1,825 (4.1%)
2005 Result: Labour 19,130 (43%), Conservative 16,204 (36.5%), Liberal Democrat 6,514 (14.7%), BNP 1,790 (4&)
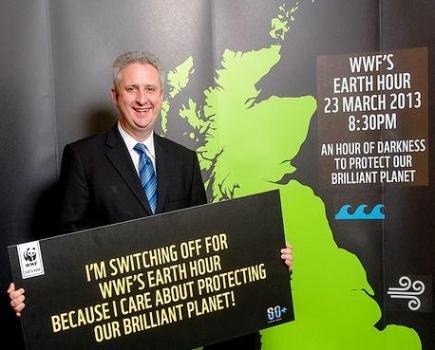
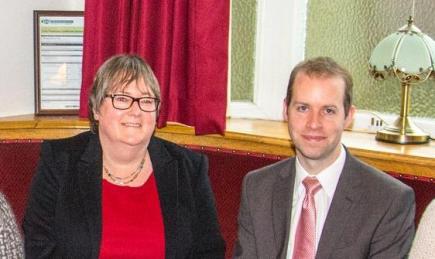
Labour MP Ivan Lewis (©WWF United Kingdom, with thanks)
Bury South
Held by Labour’s Ivan Lewis since 1997.
Candidates: Ivan Lewis (Labour), Daniel Critchlow (Conservative), Paul Ankers (Liberal Democrat)
2010 Result: Labour 19,508 (40.4%), Conservative 16,216 (33.6%), Liberal Democrat 8,796 (18.2%), BNP 1,743 (3.6%)
2005 Result: Labour 19,741 (50.4%), Conservative 10,829 (27.7%), Liberal Democrat 6,968 (17.8%), UKIP 1,059 (2.7%)
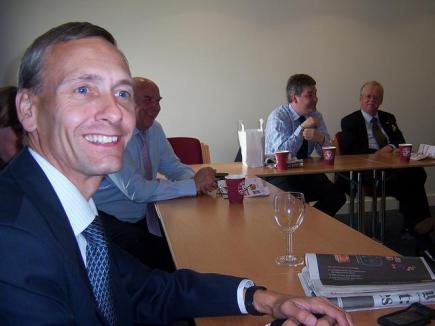
Lib Dem MP Mark Hunter (©Liberal Democrats, with thanks)
Cheadle
Traditionally a marginal seat between Conservative and Liberal Democrats, who currently have the stronghold with MP Mark Hunter.
Candidates: Mark Hunter (Liberal Democrat), Mary Robinson (Conservative), Martin Miller (Labour), Shaun Hopkins (UKIP)
2010 Result: Liberal Democrat 24,717 (47.1%), Conservative 21,445 (40.8%), Labour 4,920 (9.4%), UKIP 1,430 (2.7%)
2005 Result: Liberal Democrat 23,189 (48.9%), Conservative 19,169 (40.4%), Labour 4,169 (8.8%), UKIP 489 (1%)
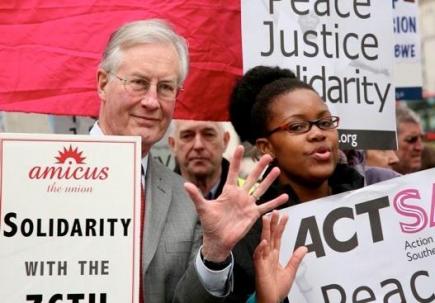
Labour MP Andrew Gwynne (©Jubilee Debt Campaign, with thanks)
Denton and Reddish
Safe Labour seat, held by Andrew Gwynne since 2005.
Candidates: Andrew Gwynne (Labour), Mark Jewell (Liberal Democrat)
2010 Result: Labour 19,191 (51%), Conservative 9,360 (24.9%), Liberal Democrat 6,727 (17.9%), UKIP 2,060 (5.5%)
2005 Result: Labour 20,340 (57.4%), Conservative 6,842 (19.3%), Liberal Democrat 5,814 (16.4%), BNP 1,326 (3.7%)
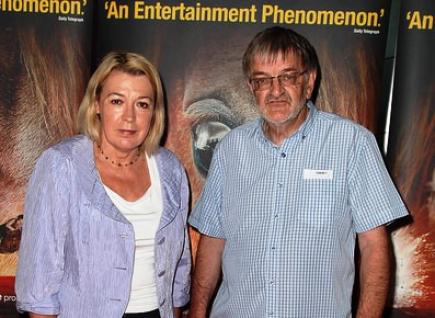
Hazel Grove
Held by the Liberal Democrats since 1997, currently Andrew Stunell, but the Conservatives increased their share of the vote for the first time since 1992 at the last election.
Candidates: Lisa Smart (Liberal Democrat), William Wragg (Conservative), Michael Taylor (Labour), Darran Palmer (UKIP).
2010 Result: Liberal Democrat 20,485 (48.8%), Conservative 14,114 (33.6%), Labour 5,234 (12.5%), UKIP 2,148 (5.1%).
2005 Result: Liberal Democrat 19,355 (49.5%), Conservative 11,607 (29.7%), Labour 6,834 (17.5), UKIP 1,321 (3.4%).
Labour MP Liz McInnes (©BBC, via YouTube, with thanks)
Heywood and Middleton
Held narrowly by Labour from UKIP in last year’s by-election, following the death of Jim Dobbin.
Candidates: Liz McInnes (Labour), Iain Gartside (Conservative), Anthony Smith (Liberal Democrat), John Bickley (UKIP), Abi Jackson (Green).
2014 By-election: Labour 11,633 (40.9%), UKIP 11,016 (38.7%), Conservative 3,496 (12.3%), Liberal Democrat 1,457 (5.1%), Green 870 (3.1%).
2010 Result: Labour 18,499 (40.1%), Conservative 12,528 (27.2%), Liberal Democrat 10,474 (22.7%), BNP 3,239 (7%), UKIP 1,215 (2.6%), Independent 170 (0.4%).
2005 Result: Labour 19,438 (49.8%), Conservative 8,355 (21.4%), Liberal Democrat 7,261 (18.6), BNP 1,855 (4.7%), Liberal 1,377 (3.5%), UKIP 767 (2%).
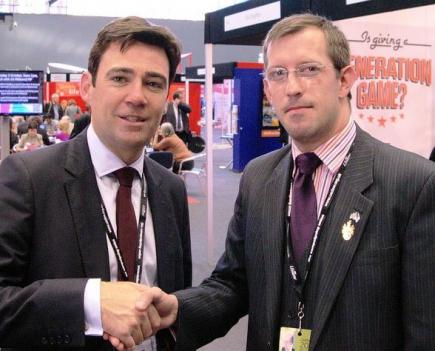
Labour MP Andy Burnham (left) (©Anthony McKeown, with thanks)
Leigh
Labour since 1922, currently held by shadow health secretary Andy Burnham.
Candidates: Andy Burnham (Labour), Bill Winlow (Liberal Democrat), Les Legget (UKIP).
2010 Result: Labour 24,295 (51.3%), 9,284 (19.6%), Liberal Democrat 8,049 (17%), BNP 2,724 (5.8%), UKIP 1,535 (3.2%), Independent 988 (2.1%), Independent 320 (0.7%), Christian 137 (0.3%).
2005 Result: Labour 23,097 (63.3%), Conservative 5,825 (16%), Liberal Democrat 4,962 (13.6%), Community Action 2,185 (6%), Legalise Cannabis 415 (1.1%).
Labour MP Yvonne Fovargue (©Labour Party, with thanks)
Makerfield
One of the safest Labour seats in the country, with the area (including predecessor constituencies) being held by Labour since the party was formed in 1906.
Candidates: Yvonne Fovargue (Labour), John Skipworth (Liberal Democrat), Andrew Collinson (UKIP).
2010 Result: Labour 20,700 (47.3%), Conservative 8,210 (18.8%), Liberal Democrat 7,082 (16.2%), Independent 4,324 (7.8%), BNP 3,229 (7.4%), Independent 1,126 (2.6%).
2005 Result: Labour 22,494 (63.2%), Conservative 4,345 (12.2%), Liberal Democrat 3,789 (10.6%), Community Action 2,769 (7.8%), BNP 1,221 (3.4%), UKIP 962 (2.7%).
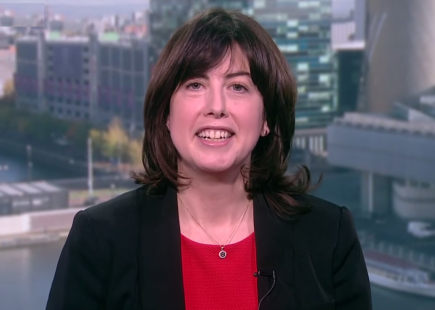
Labour MP Lucy Powell (©BBC, via YouTube, with thanks)
Manchester Central
Safe Labour seat since its creation in 1974, currently held by Lucy Powell.
Candidates: Lucy Powell (Labour), Xingang Wang (Conservative), Pete Wild (Liberal Democrat), Myles Power (UKIP), Kieran Turner-Dave (Green).
2012 By-election: Labour Co-Op 11,507 (69.1%), Liberal Democrat 1571 (9.4%), Conservative 754 (4.5%), UKIP 749 (4.5%), Green 652 (3.9%), BNP 492 (3%), Pirate 308 (1.9%), TUSC 220 (1.3%), Respect 182 (1.1%), Monster Raving Loony 78 (0.5%), People’s Democratic Party 71 (0.4%), Communist League 64 (0.4%).
2010 Result: Labour 21,059 (52.7%), Liberal Democrat 10,620 (26.6%), Conservative 4704 (11.8%), BNP 1636 (4.1%), Green 915 (2.3%), UKIP 607 (1.5%), Socialist Labour 153 (0.4%), Independent 120 (0.3%), Workers Revolutionary Party 59 (0.1%), Socialist Equality 54 (0.1%).
2005 Result: Labour Co-Op 16,993 (58.1%), Liberal Democrat 7217 (24.7%), Conservative 2,504 (8.6%), Green 1,292 (4.4%), National Front 421 (1.4%), Independent Progressive Labour 382 (1.3%), UKIP 272 (0.9%), Socialist Labour 183 (0.6%).
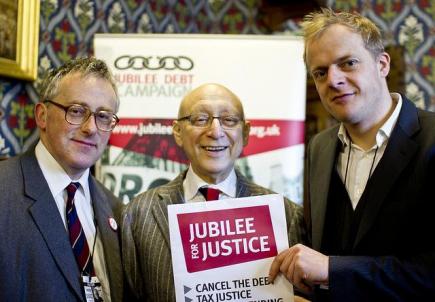
Labour’s Sir Gerald Kaufman (©Jubilee Debt Campaign, with thanks)
Manchester Gorton
Yet more safe Labour territory, even though the Lib Dems have polled at over 30% in the last two elections, held by Sir Gerald Kaufman since 1983.
Candidates: Sir Gerald Kaufman (Labour), Mohammed Afzal (Conservative), Laura Bannister (Green), Dave Page (Liberal Democrat).
2010 Result: Labour 19,211 (50.1%), Liberal Democrat 12,508 (32.6), Conservative 4,224 (11%), Green 1048 (2.7%), Respect-Unity Coalition 507 (1.3%), Trade Unionist and Socialist Coalition 337 (0.9%), Christian 254 (0.7%), Pirate Party 236 (0.6%).
2005 Result: Labour 15,480 (53.2%), Liberal Democrat 9,672 (33.2%), Conservative 2,848 (9.8%), UKIP 733 (2.7%), Workers Revolutionary 181 (0.6%), Resolutionist 151 (0.5%)
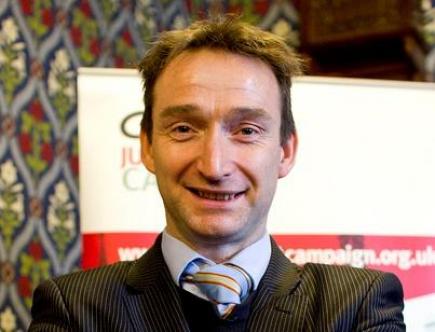
Lib Dem MP John Leech (©World Development Movement Manchester, with thanks)
Manchester Withington
Turned red for the first time in the 1980s having been mostly Conservative before then, but has been a Lib Dem seat for John Leech since 2005.
After tight races at the last two elections, Labour will be looking to capitalise on the Lib Dems collapse in popularity nationally.
Candidates: John Leech (Liberal Democrat), Jeff Smith (Labour), Rob Manning (Conservative), Mark Davies (UKIP), Lucy Bannister (Green).
2010 Result: Liberal Democrat 20,110 (40.6%), Labour 18,260 (40.5%), Conservative 5,005 (11.1%), Green 798 (1.8%), UKIP 698 (1.5%), Independent 147 (0.3%), Independent 57 (0.1%).
2005 Result: Liberal Democrat 15,872 (42.2), Labour 15,205 (40.6%), Conservative 3,919 (10.5%), Green 1,595 (4.3%), UKIP 424 (1.1%), Independent 243 (0.6%), Independent 152 (0.4%), Their Party 47 (0.1%).
Labour MP Debbie Abrahams (©Amnesty International, with thanks)
Oldham East and Saddleworth
Traditionally a Labour-Lib Dem marginal seat, the 2010 result was declared void on petition after Labour’s Phil Woolas was found to have made false statements about Lib Dem opponent Elwyn Watkins in his election literature.
However, with the Lib Dem’s popularity plunging, Labour won the by-election by the largest majority since the seat was created.
Candidates: Debbie Abrahams (Labour), Richard Marbrow (Liberal Democrat), Sajjad Hussein (Conservative), Miranda Meadowcroft (Green).
2011 By-election: Labour 14,718 (42.1%), Liberal Democrat 11,160 (31.9%), Conservative 4,481 (12.8%), UKIP 2,029 (5.8%), BNP 1,560 (4.5%), Green 530 (1.5%), Monster Raving Loony 145 (0.4%), English Democrats 144 (0.4%), Pirate 96 (0.3%), Bus Pass Elvis 67 (0.1%).
2010 Result: Labour 14,186 (31.9%), Liberal Democrat 14,083 (31.6%), Conservative 11,773 (26.4%), BNP 2,546 (5.7%), UKIP 1,720 (3.9%), Christian 212 (0.5%).
2005 Result: Labour 17,968 (41.4%), Liberal Democrat 14,378 (33.2%), Conservative 7,901 (18.2%), BNP 2,109 (4.9%), UKIP 873 (2%), Independent 138 (0.3%).
Labour MP Michael Meacher (©Rude Cech, with thanks)
Oldham West and Royton
Held by Labour’s Michael Meacher, who has represented the area (and its predecessor constituencies) since 1970.
Gained notoriety in 2001 when ex-BNP leader Nick Griffin took third place, though their share of the vote has dropped since then.
Candidates: Michael Meacher (Labour), Gareth Harkness (Liberal Democrat).
2010 Result: Labour 19,503 (45.5%), Conservative 10,151 (23.7%), Liberal Democrat 8,193 (10.1%), BNP 3,049 (7.1%), UKIP 1,387 (3.2%), Respect-Unity Coalition 627 (1.5%).
2005 Result: Labour 18,452 (49.1%), Conservative 7,998 (21.3%), Liberal Democrat 7,519 (20%), BNP 2,606 (6.9%), UKIP 987 (2.6%).
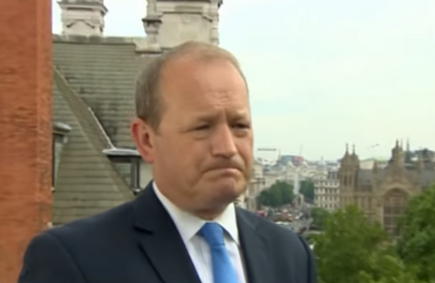
Labour MP Simon Danczuk (©BBC, via YouTube, with thanks)
Rochdale
Labour-Lib Dem marginal seat, won by Labour in 2010 despite leader Gordon Brown labelling constituent Gillian Duffy a ‘bigot’ during the campaign.
Candidates: Simon Danczuk (Labour), Azi Ahmed (Conservative), Andy Kelly (Liberal Democrat), Masud Mohammed (UKIP).
2010 Result: Labour 16,699 (36.4%), Liberal Democrat 15,810 (34.4%), Conservative 8,305 (18.1%), National Front 2,236 (4.9%), UKIP 1,999 (4.4%), Islam Zinda Baad Platform 545 (1.2%), Independent 313 (0.7%).
2005: Liberal Democrat 16,787 (41.1%), Labour 16,345 (40%), Conservative 4,270 (10.5%), BNP 1,773 (4.3%), UKIP 499 (1.2%), Green 448 (1.1%), Islam Zinda Baad Platform (0.9%), Veritas 353 (0.9%).
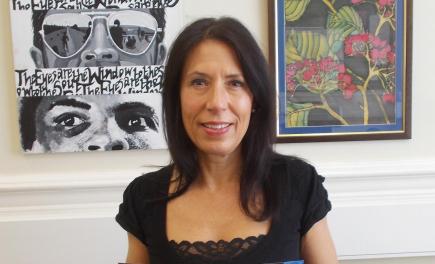
Labour MP Hazel Blears (©University of Salford, with thanks)
Salford and Eccles
Created in 2010 and since represented by Labour’s Hazel Blears, who is stepping down.
Former Happy Mondays star Bez has announced his intention to stand, though this has been thrown into question after the Electoral Commission ruled that his Reality Party’s registration was invalid.
Candidates: Rebecca Long-Bailey (Labour), Greg Downes (Conservative), Emma van Dyke (Green), Dawne Sheldrick-Keating (Class War), Sam Clark (Pirate), Bez (?)
2010 Result: Labour 16,655 (40.1%), Liberal Democrat 10,930 (26.3%), Conservative 8,497 (20.5%), BNP 2,632 (6.3%), UKIP 1084 (2.6%), Trade Unionist and Socialist Coalition 730 (1.8%), English Democrats 621 (1.5%), Independent 384 (0.9%).
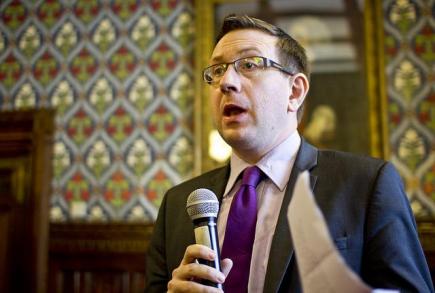
Labour MP Jonathan Reynolds (©Anthony McKeown, with thanks)
Stalybridge and Hyde
Safe territory for Labour, who have held the seat since 1945.
Candidates: Jonathan Reynolds (Labour), Martin Riley (Conservative).
2010 Result: Labour 16,189 (39.6%), Conservative 13,445 (32.9%), Liberal Democrat 6965 (17%), BNP 2259 (5.5%), UKIP 1342 (3.3%), Green 679 (1.7%).
2005 Result: Labour 17,535 (49.7%), Conservative 9187 (26%), Liberal Democrat 5,532 (15.7%), BNP 1,399 (4%), Green 1088 (3.1%), UKIP 573 (1.6%).
Labour MP Ann Coffey (©Manchester Friends of the Earth, with thanks)
Stockport
Solid Labour territory since incumbent Ann Coffey first won the seat in 1992.
Candidates: Ann Coffey (Labour), Daniel Hawthorne (Liberal Democrat), Steven Woolfe (UKIP), Gary Lawson (Green), Matt Officer (Class War).
2010 Result: Labour 16,697 (42.7%), Conservative 9,913 (25.3%), Liberal Democrat 9,778 (25%), BNP 1,201 (3.1%), UKIP 862 (2.2%), Green 677 (1.7%).
2005 Result: Labour 18,069 (50.5%), Conservative 8,906 (24.9%), Liberal Democrat 7,832 (21.9%), UKIP 964 (2.7%).
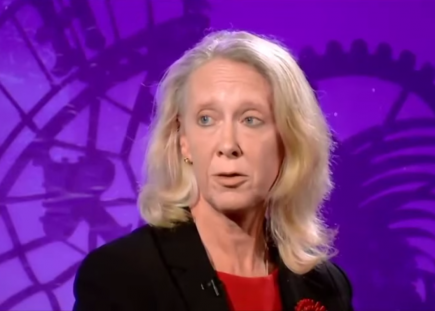
Labour MP Kate Green (©LadyGeekTV, with thanks)
Stretford and Urmston
Trafford seat is safe for Labour, despite a few strong conservative areas. The Lib Dems are the only other party to have gained more than 5% of the vote in Stretford and Urmston.
Candidates: Kate Green (Labour), Lisa Cooke (Conservative), Louise Ankers (Liberal Democrat), Geraldine Coggins (Green).
2010 Result: Labour 21,821 (48.6%), Conservative 12,886 (28.7%), Liberal Democrat 7,601 (16.9%), UKIP 1,508 (3.4%), Green 915 (2%), Christian 178 (0.4%).
2005 Result: Labour 19,417 (51%), Conservative 11,566 (30.4%), Liberal Democrat 5,323 (14%), Respect 950 (2.5%), UKIP 845 (2.2%).
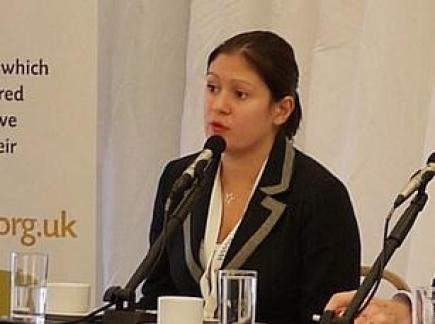
Labour MP Lisa Nandy (©NCVO London, with thanks)
Wigan
Safe Labour territory, having held the seat since 1918.
Candidates: Lisa Nandy (Labour), Mark Clayton (Liberal Democrat).
2010 Result: Labour 21,404 (48.5%), Conservative 10,917 (24.7%), Liberal Democrat 6797 (15.4%), UKIP 2,516 (5.7%), BNP 2,506 (5.7%).
2005 Result: Labour 18,901 (55.1%), Conservative 7,134 (20.8%), Liberal Democrat 6,051 (17.7%), UKIP 1166 (3.4%), Community Action 1,026 (3%).
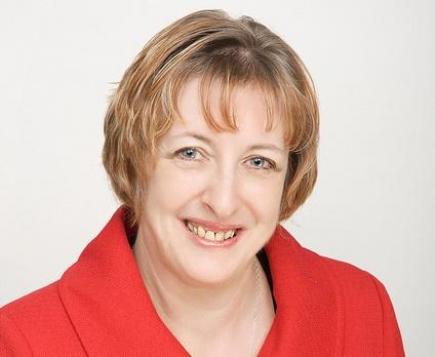
Labour MP Barbara Keeley (©The Lowry, with thanks)
Worsley and Eccles South
A couple of strong Conservative wards, but still should still be relatively safe for Labour.
Candidates: Barbara Keeley (Labour), Iain Lindley (Conservative), Kate Clarkson (Liberal Democrat), Christopher Bertenshaw (Green), Jackie Anderson (Reality Party).
2010 Result: Labour 17,892 (42.7%), Conservative 13,555 (32.5%), Liberal Democrat 6,883 (16.5%), UKIP, 2,037 (4.9%), English Democrats 1,334 (3.2%).
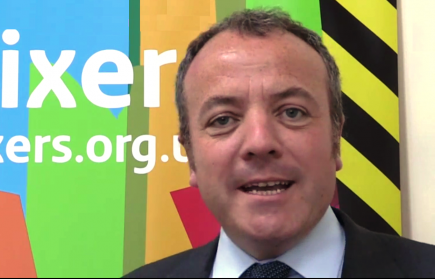
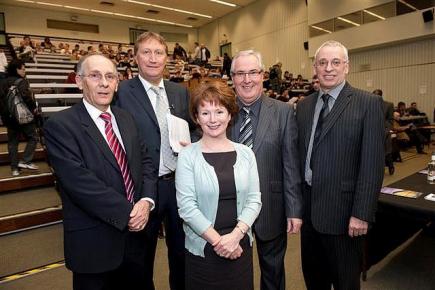
Labour MP Mike Kane (©Fixers Uk, via YouTube, with thanks)
Wythenshawe and Sale East
Safe Labour seat represented by Mike Kane after Paul Goggins’ death last year. UKIP pushed the Conservatives into third place in 2014’s by-election.
Candidates: Mike Kane (Labour), Fiona Green (Conservative), Victor Chamberlain (Liberal Democrat), Jessica Mayo (Green).
2014 By-election: Labour 13,261 (55.3%), UKIP 4,301 (18%), Conservative 3,479 (14.5%), Liberal Democrat 1,176 (4.9%), Green 748 (3.1%), BNP 708 (3%), Monster Raving Loony 288 (1.2%).
2010 Result: Labour 17,987 (44.1%), Conservative 10,412 (25.6%), Liberal Democrat 9,107 (22.3%), BNP 1572 (3.9%), UKIP 1405 (3.4%), TUSC 268 (0.7%).
2005 Result: Labour 18,878 (52.2%), Conservative 8,051 (22.3%), Liberal Democrat 7,766 (21.5%), UKIP 1,120 (3.1%), Socialist Alternative 369 (1%).
Main image courtesy of Number 10, with thanks.